En este post veremos cómo interceptar un problema de clasificación estadística desde el principio. Para ello, usaremos un dataset de bicicletas.
¿Qué encontrarás en este post?
ToggleContextualización
Las características del dataset son las siguientes:
Fanace – T, Hadi, and Gama, Joao, «Event labeling combining ensemble detectors and background knowledge». Progress in Artificial Intelligence (2013) pp. 1-15, Springer Berlin Heidelberg, doi:10.1007/s13748-013-0040-3.
- instant: record index
- dteday date
- season: season (1:springer, 2:summer, 3:fall, 4:winter)
- yr: year (0: 2011, 1:2012)
- mnth: month ( 1 to 12)
- hr hour (8 to 23)
- holiday: weather day is holiday or not (extracted from http://dchr.dc.gov/page/holiday-schedule)
- weekday: day of the week
- workingday: if day is neither weekend nor holiday is 1, otherwise is 0.
- weathersit:
- 1: Clear, Few clouds, Partly cloudy, Partly cloudy
- 2: Mist + Cloudy, Mist + Broken clouds, Mist Few clouds, Mist
- 3: Light Snow, Light Rain + Thunderstorm + Scattered clouds, Light Rain Scattered clouds
- 4: Heavy Rain + Ice Pallets + Thunderstorm + Mist, Snow + Fog
- temp: Normalized temperature in Celsius. The values are divided to 41 (max)
- atemp: Normalized feeling temperature in Celsius. The values are divided to 50 (max)
- hum: Normalized humidity. The values are divided to 100 (max)
- windspeed: Normalized wind speed. The values are divided to 67 (max)
- casual: count of casual users
- registered: count of registered users
- cnt: count of total rental bikes including both casual and registered
Interceptar un problema de clasificación estadística: ejemplo
#interceptar un problema de clasificación estadística
df_bike_orig <- read.csv ('data/bike-sharing-hour.csv')
head (df_bike_orig)

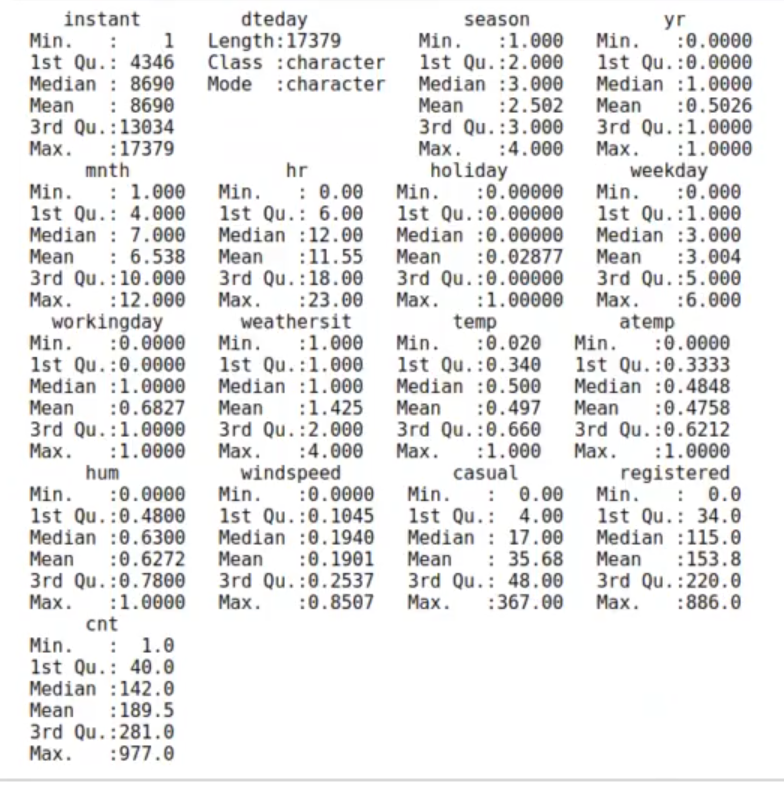
summary (df_bike_orig)
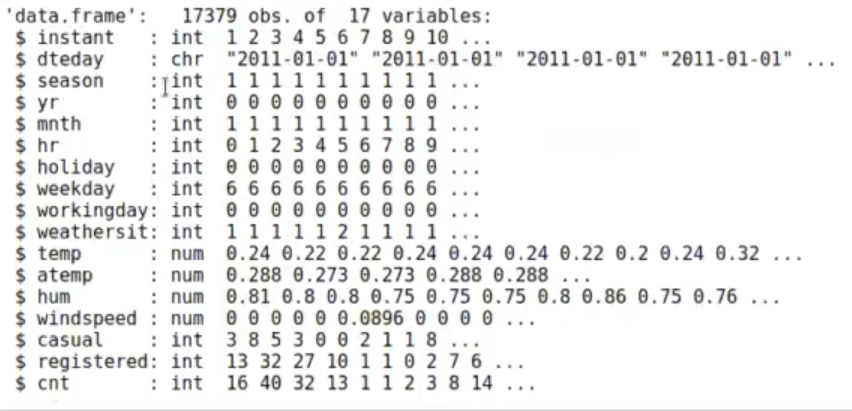
str (df_bike_orig)
#interceptar un problema de clasificación estadística
library (dplyr)
df_bike <- df_bike_orig %>% select (-instant) %>% mutate(
dteday = as.POSIXct (dteday),
holiday = factor (holiday ,labels = c ("NO", "YES")),
workingday = factor (workingday, labels=c("NO", "YES")).
hr_i = sin (hr / 24 - 2 * pi),
hr_j = cos (hr / 24 * 2 * pi),
mnth_i = sin (mnth / 12 * 2 * pi),
mnth_j = cos (mnth / 12 * 2 * pi),
weathersit_fct = factor (weathersit)
)
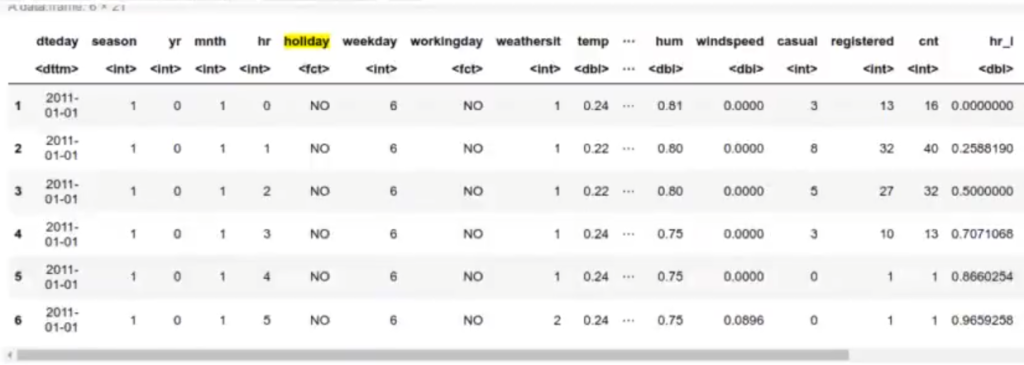
head (df_bike)
Attaching package: ‘dplyr’
The following objects are masked from ‘package:stats’:
filter, lag
The following objects are masked from ‘package:base’:
intersect, setdiff, setequal, union
library(ggplot2)
#interceptar un problema de clasificación estadística
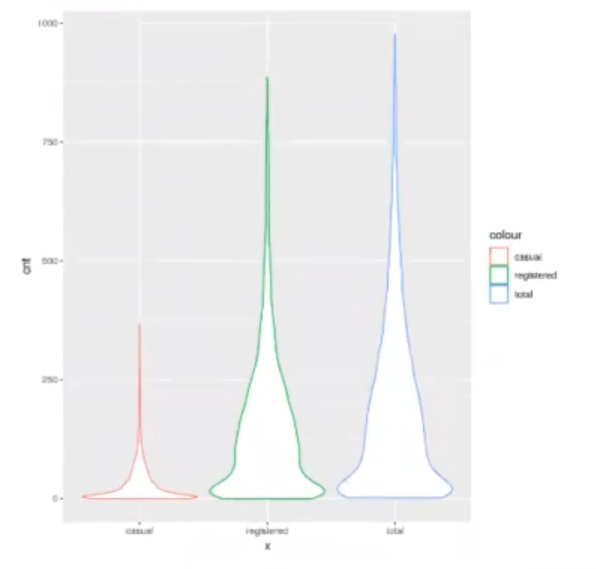
ggplot (df_bike) + geom_violin (aes (x = "total", y = cnt, color = "total")) +
geom_violin (aes (x = "casual", y = casual, color = "casual")) +
geom_violin (aes (x = "registered", y = registered, color = "registered"))
#interceptar un problema de clasificación estadística
options (repr.plot.height = 4, repr.plot.width = 8, repr.plot.res = 200)

library (GGally)
options (warn = -1)
ggpairs (df_bike %>% select (holiday, workingday, weathersit, temp, atemp, hum, windspeed, casual, registered),
#lower = list (continuous = wrap ("density", alpha = 0.8, size = 0.2, color = 'blue'))
lower = list (continuous = wrap ("points", alpha = 0.3, size = 0.1, color = 'blue'))
) + theme (axis.text.x = element_text (angle = 45, hjust = 1))

Se puede ver que existe una gran correlación entre atemp y temp, como cabría esperar.
También vemos que el comportamiento entre usuarios casuales y registrados es diferente. Los usuarios casuales parecen aumentar a medida que hace buen tiempo y parecen bajar con humedad alta más que los usuarios registrados. El viento parece afectar a ambos por igual.
Así que si queremos un modelo para predecir el número de usuarios totales, deberíamos crear uno para casuales y otro para registrados.
idx <- sample (1 : nrow (df_bike), nrow (df_bike) * 0.7)
df_bike.train <- df_bike [idx,]
df_bike.test <- df_bike [-idx.]
model <- Im (df_bike.train, formula = casual~ holiday-workingday + weathersit + temp + atemp + hum + windspeed) summary (model)
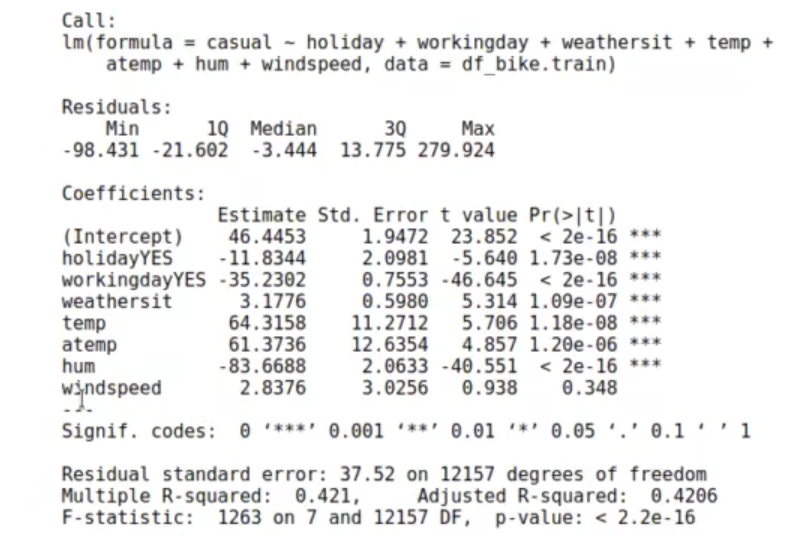
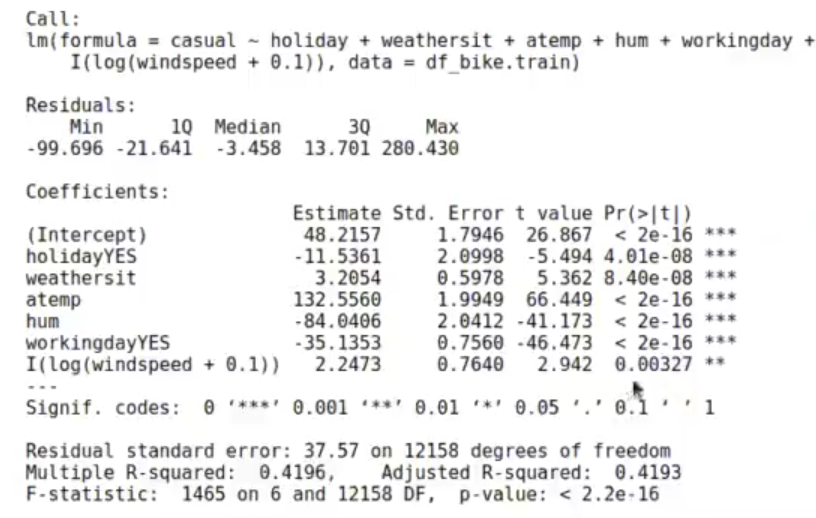
Le quitamos el tempt al algoritmo:
#interceptar un problema de clasificación estadística
model <- Im (df_bike.train, formula = casual~ holiday-workingday + weathersit + atemp + hum + windspeed) summary (model)
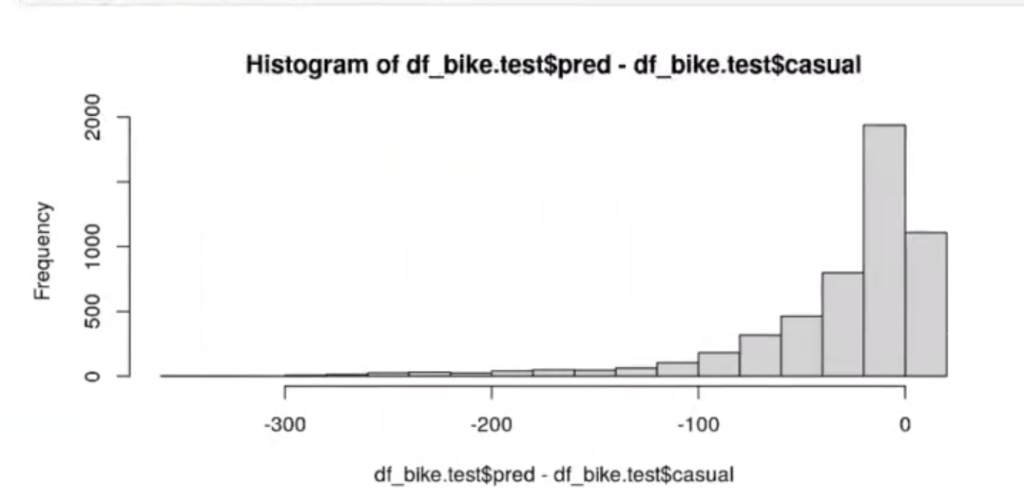
df_bike.test$pred <- predict (model, df_bike.test)
caret :: postResample (df_bike.test$pred, df_bike.test$casual)
RMSE: 58.1637596174495
Rsquared: 0.412022171406928
MAE: 32.4142362357307
hist (df_bike.tst$pred - df_bike.test$casual)
Por último, recuerda que si te apasiona el Big Data y no sabes cómo continuar estudiando esta temática, en KeepCoding tenemos para ti el Big Data, Inteligencia Artificial & Machine Learning Full Stack Bootcamp, una formación intensiva en la que podrás aprender todo lo necesario para incursionar rápidamente en el mercado laboral. ¡Anímate a cambiar tu vida y solicita más información!


